

This free OKR spreadsheet template keeps a team’s objectives and key results in one file, logs a weekly check-in for every key result, and turns both into a dashboard. We built it for founders, team leads and HR leads who want OKRs up and running this week, whichever of Google Sheets or Excel they live in.
Make a copy in Google Sheets Download for Excel (.xlsx)
Make a copy in Google Sheets (you’ll need a Google account), or skip the sign-in and download it for Excel. Example rows are already in both, ready to type over. Below, you’ll find the setup and then the weekly routine.
What’s in the OKR spreadsheet template
The file has five tabs, and each one has a single job. You fill in the OKRs, Check-ins and Settings tabs. The Dashboard fills itself, and Start here holds the instructions.
| Tab | What it holds |
|---|---|
| Start here | The setup steps and what each health status means |
| OKRs | One row per key result, with its owner, start and target. Gray columns calculate progress and health |
| Check-ins | The log, with one new row per update |
| Dashboard | Each objective from the OKRs tab against the share of the cycle gone |
| Settings | Cycle dates, the stale threshold and the health options |
Anything marked “(example)” is invented. It’s there so you can see the file work before you type a single row. Open a copy in March or in November, and it still looks like a quarter in full swing, because the example dates count back from today and the cycle defaults to the current quarter.
Google Sheets or Excel: where they differ
The choice is mostly about where your files already live. If that’s Microsoft 365, with everything on OneDrive or SharePoint, take the Excel file; anywhere else, the Google Sheets copy is the easier start. The tabs, columns and example rows match in both files. Three things differ:
- Latest check-in. XLOOKUP works as written in Google Sheets. Excel 2016 and Excel 2019 don’t have XLOOKUP, so on those versions use the LOOKUP formulas from the Start here tab.
- Progress bars. Google Sheets draws them with the SPARKLINE function, right inside the cell. Excel gets the same effect from data bars, a conditional format.
- Working together. In Google Sheets, share the file with edit access, and version history shows who changed a cell. Co-authoring in the Excel desktop app needs Microsoft 365, the file on OneDrive or SharePoint Online, and AutoSave on.
How to set up the template
-
Copy the file. The Google Sheets link needs you signed in to Google, because it saves the copy to your own Drive. The Excel link is simpler still: it downloads an .xlsx file and asks for no sign-in at all.
-
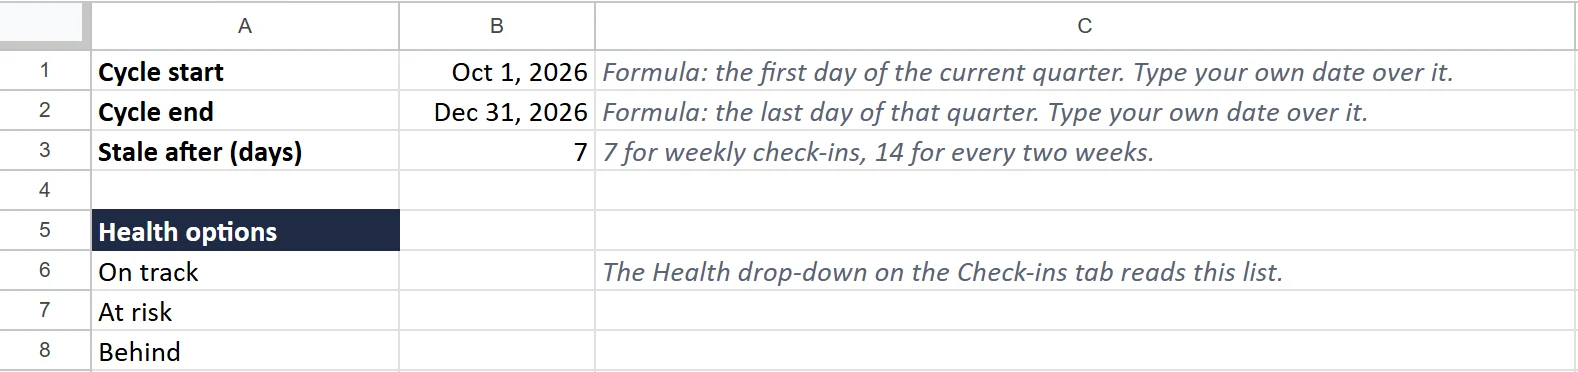
Set the cycle on the Settings tab. Either type your own start and end dates or leave the formulas in place; they track the current calendar quarter. The stale threshold sits on the same tab and counts days, so 7 suits weekly check-ins and 14 suits a check-in every two weeks.
-
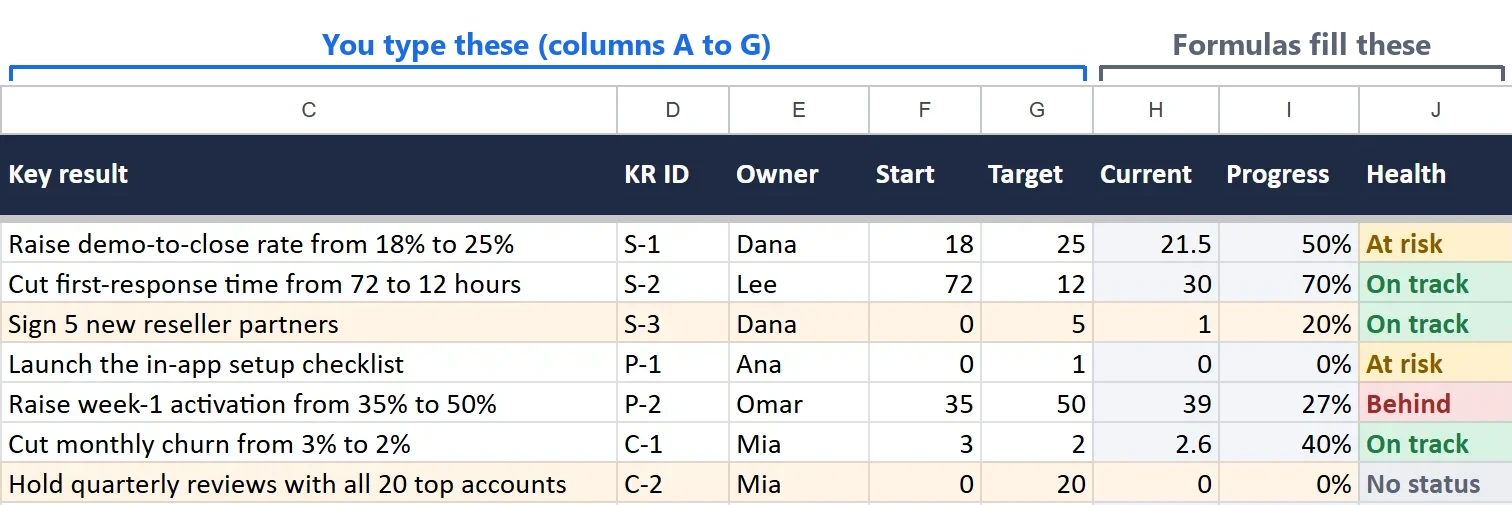
Fill in the OKRs tab. Type over the example rows in columns A to G: team (write Company for company-wide objectives), objective, key result, a short KR ID such as S-1, one owner, a start value and a target. Write each objective the same way on every one of its rows, because the dashboard groups key results by that text. Then clear the example rows on the Check-ins tab (their comments start with “Example:”), or a KR ID you reuse will pick up their values.
-
Check the Dashboard tab. Column A fills with your objectives automatically, up to 10 (enough for one or two teams), in the order they first appear on the OKRs tab. If one shows up twice, it’s spelled two different ways on the OKRs tab.

-
Share it and protect the formulas. Give the key-result owners edit access, then protect the gray columns. Google’s help center says protection “shouldn’t be used as a security measure”, since anyone with access can still copy the file. It stops accidents, and that’s all you need here.
The example rows cover the three kinds of key results you’ll write:
| Kind | Example from the file |
|---|---|
| Rising | Raise demo-to-close rate from 18% to 25% (start 18, target 25) |
| Falling | Cut first-response time from 72 to 12 hours (start 72, target 12) |
| Done or not | Launch the in-app setup checklist (start 0, target 1) |
A falling key result simply has a target below its start. A done-or-not key result goes from 0 to 1, the way Google’s re:Work guide grades a launch. Use those sparingly: a launch shows the work got done, not what it changed.
Keep the list short, too: the same guide describes three to five objectives with about three key results each, or roughly 9 to 15 rows per team. Need more rows than the file has ready? Select the gray cells of the last filled row and drag them down.
Run the weekly check-in from the sheet
A sheet is only as current as its last entry, which is why the routine should stay small. Each week, the owner of every key result adds one row for it to the Check-ins tab, with the date, its KR ID picked from the drop-down, the new value, a health status (On track, At risk or Behind) and a one-line comment.
Nobody edits history here: new rows go under the old ones, which stay untouched. So the lowest matching row is what the formulas treat as the current value. Typed a wrong number? Add a corrected row below it, and the log still shows every update in order.
Numbers leave out the why, and that’s the comment’s job. This format is short enough to fill in every week:
What moved: two demos closed this week.
What’s blocking: the third deal is waiting on legal review.
Next step and date: the two open proposals go out by Thursday.
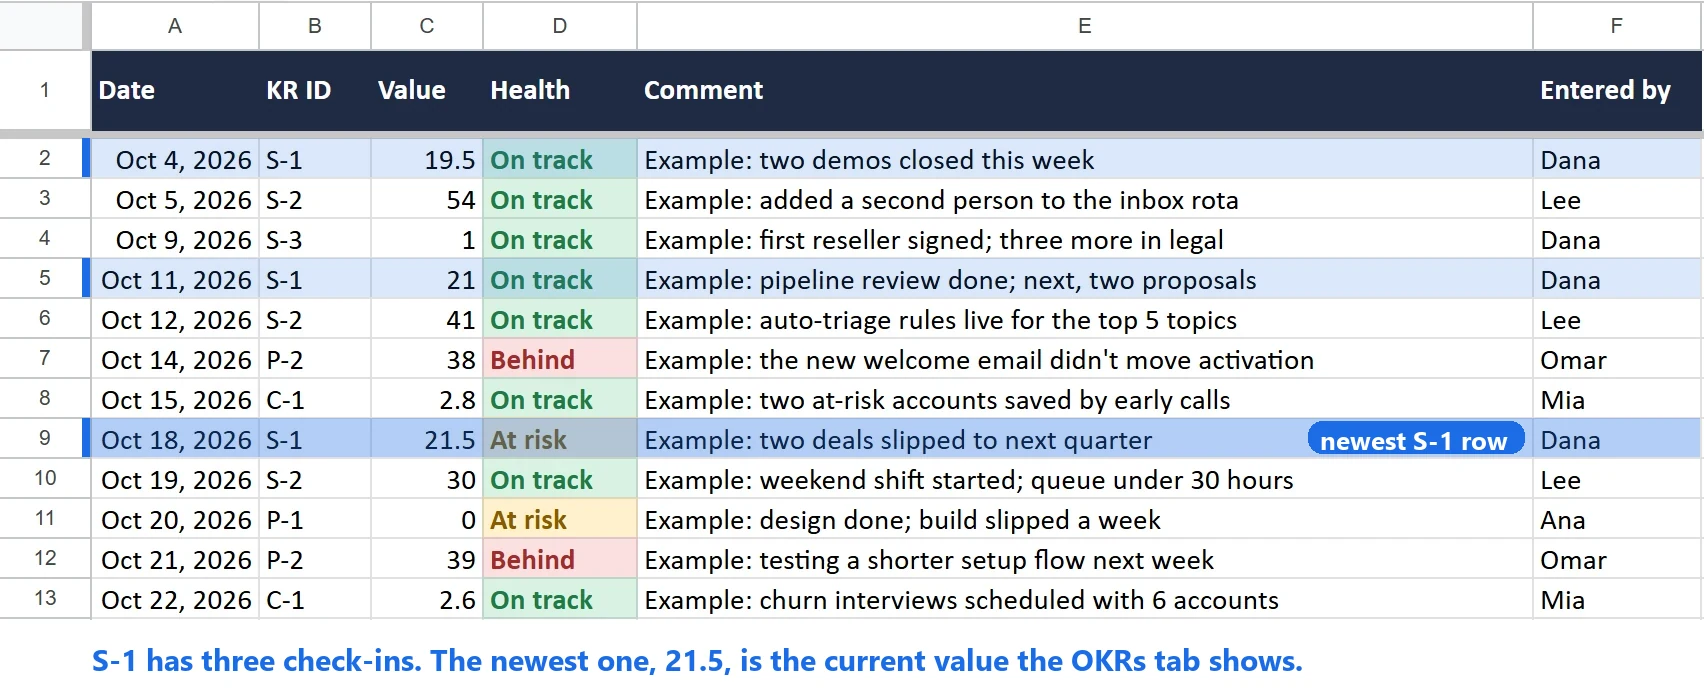
You’ll know the routine has taken hold when, after the first week, no key result shows “No status” and the dashboard’s stale count is zero. For running the meeting that follows, see our guide to OKR check-in meetings.
Read the dashboard on Monday
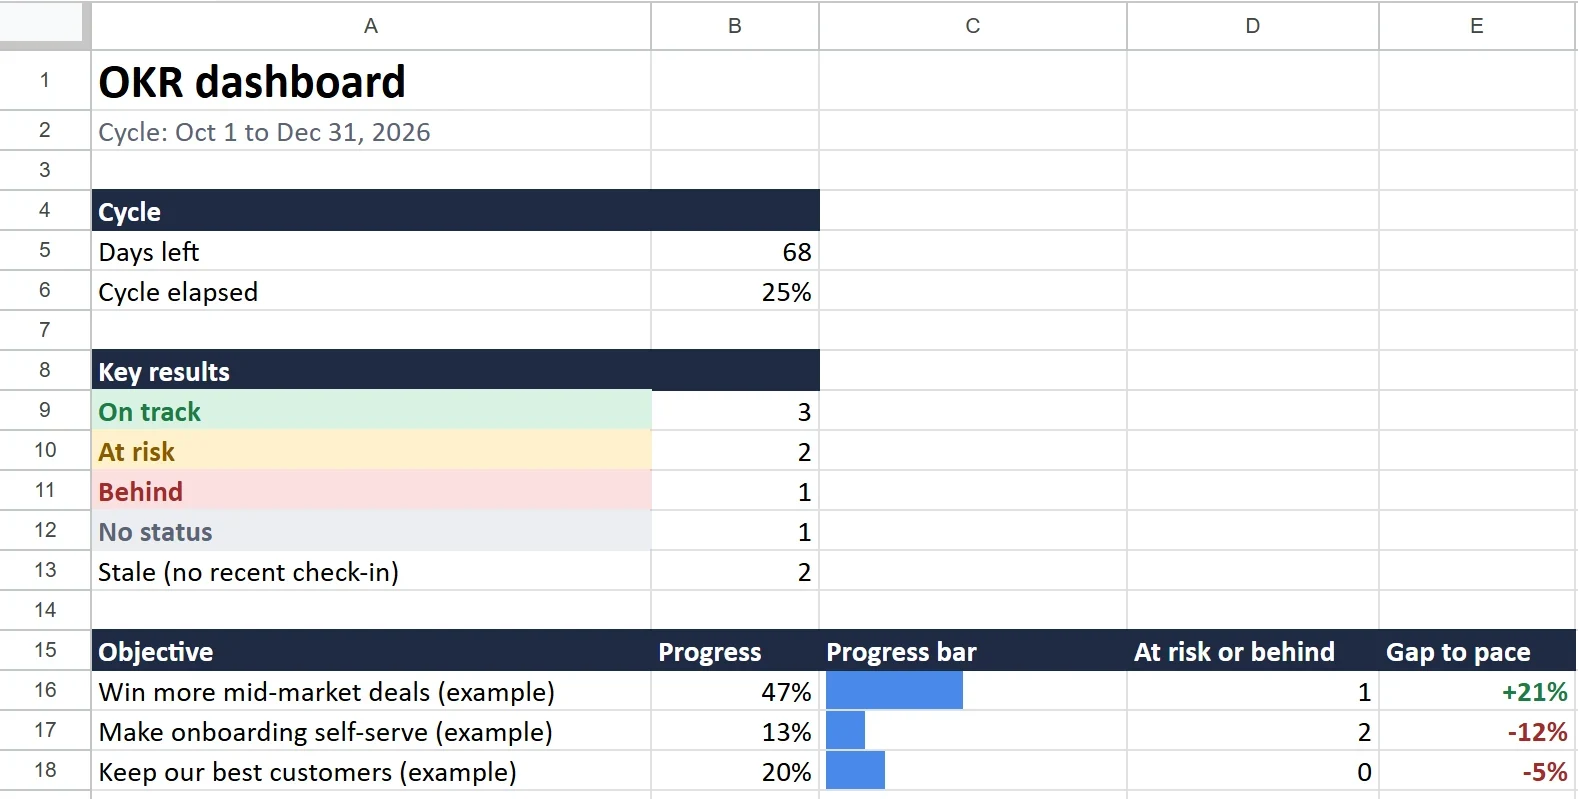
Open the Dashboard tab before the weekly review and read it in this order:
- Cycle elapsed: the share of the cycle that has already passed, from the Settings dates.
- Gap to pace: each objective’s progress minus that share. A negative gap means the objective is behind pace.
- Stale: how many key results have gone longer than the Settings threshold without a check-in. On the OKRs tab, their rows turn orange.
- At risk or behind: how many of each objective’s key results got that status in their latest check-in.
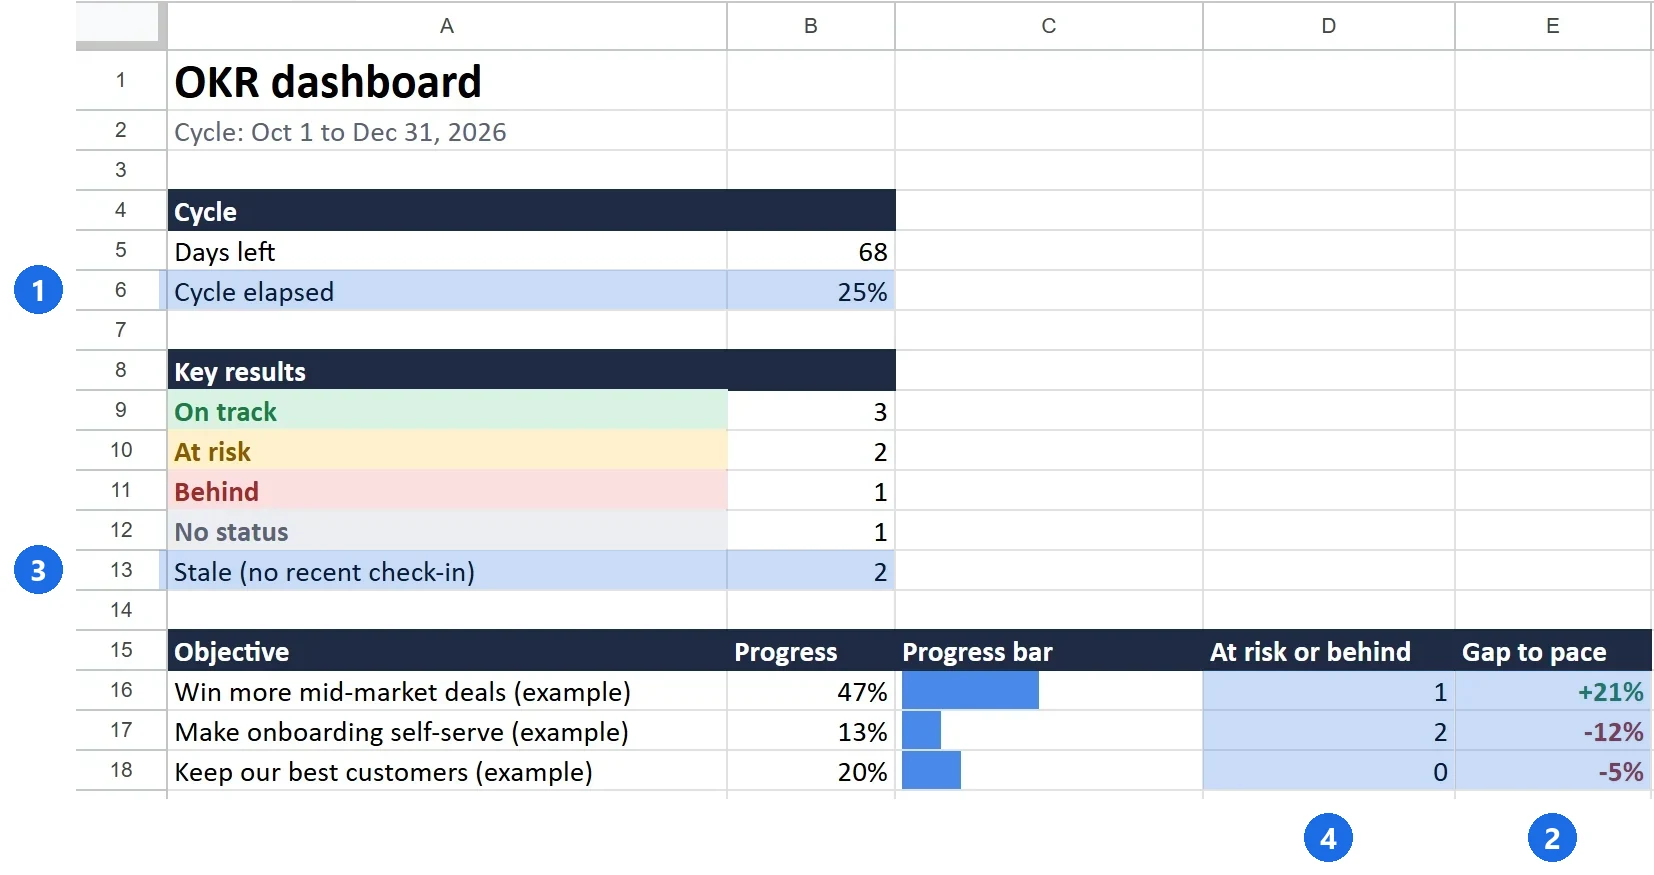
The screenshot above was taken a little over three weeks into the quarter, when 25% of the cycle had gone by. Sales is at 47%, so it’s running 21 points ahead of pace (each figure is rounded on its own). Onboarding, at 13%, trails by 12 points. Start the review with the objectives behind pace, like onboarding, and with the stale rows. Ask each owner what’s blocking progress instead of asking for a fresher number.
Close the quarter and start the next one
At the end of the quarter, the Progress column holds each key result’s grade, and the dashboard shows each objective’s. Keep that file as the record of the quarter and plan the next one in a copy. In the copy, clear columns A to G on the OKRs tab and type in the new key results, clear the old rows on the Check-ins tab, and set the new dates on the Settings tab. Our post on the typical OKR cycle covers what happens between quarters.
How the formulas work
Only planning to change a column? Then read on; otherwise, skip ahead. We ran every formula against sample rows first (a falling target, an overshoot, a key result nobody had checked in on), and the Google Sheets copy came back with the same numbers.
Progress, in column I:
=IF(COUNT(F2:H2)<3,"",IF(G2=F2,IF(H2=G2,1,0),MAX(0,MIN(1,(H2-F2)/(G2-F2)))))It divides how far the value has moved by the full distance from start to target, which works for a falling target too: response time down from 72 hours to 12, now at 30, gives (30 - 72) / (12 - 72), or 70%. MIN and MAX hold the result between 0% and 100%.
Current, Health and the date of the last check-in come from the log through XLOOKUP. Its last argument, -1, searches from the last entry to the first, so the newest check-in wins. The log has room for 500 rows; past that, raise the 500 in each formula. On the dashboard, an objective’s progress is the average progress of its key results. Google’s re:Work guide, first published in 2016, grades OKRs the same way: each key result is graded, and a rough average of those grades becomes the objective’s grade.
When does an OKR spreadsheet stop being enough?
The signs show up in the file before anyone complains. Each one has a fix you could build into the sheet, and each fix adds upkeep:
- Team copies drift apart. The sheet fix is one master file with strict edit rights. OKR software keeps one shared set of objectives and gives each team’s goals their own team page.
- The company view runs on IMPORTRANGE. Every team file needs its own link, approved with “Allow access” the first time. A tool rolls progress up on its own, through a parent-child hierarchy of aligned objectives.
- Nobody knows who changed a target. In a sheet, you check edit history cell by cell. A tool gives you an activity feed on every objective and key result.
- One person chases everyone’s updates. Calendar nudges and direct messages help, but only for a while. A tool shows every team’s stale check-ins, and whose they are, on a single dashboard, so nobody has to open file after file to find out.
- Some goals shouldn’t be public. A spreadsheet answers that with separate files and their own sharing settings. Software lets an objective be private and shared only with the people and teams you pick.
Recognize two or more? Then try a dedicated OKR tool with one team for one quarter, with the spreadsheet still going next to it. A quarter is enough to see whether the tool saves you the formula upkeep.
FAQ for OKR templates
What’s an OKR template?
It’s a file that’s set up before you type a word: you add objectives and their measurable key results, then track both through a cycle. In a spreadsheet, each key result gets a row with an owner, a start value, a target and where it stands now, and formulas turn those numbers into progress. You bring the goals, and the file does the bookkeeping.
What is a good OKR example?
Take one from the template. The sales team’s “Win more mid-market deals” comes with three key results, which ask it to lift the demo-to-close rate from 18% to 25%, cut first-response time from 72 to 12 hours and sign 5 new reseller partners. The objective names the outcome, and each key result has a start, a target and one owner, so anyone can see how far it has moved. For more, see our sales OKR examples.
How should you write an OKR?
The objective comes first. It should name an ambitious outcome (one that feels a little uncomfortable) in words plain enough for anyone to judge whether you got there. About three key results go under it. Each is a measurable milestone that moves the objective forward, and each should be easy to grade with a number. That’s the bar Google’s re:Work guide sets, and our guide to writing good OKRs goes further.
How do you score OKRs in a spreadsheet?
Read the Progress column as the grade, so 70% becomes 0.7 on the 0.0 to 1.0 scale that Google’s re:Work guide uses. A 0.7 on an ambitious goal sits inside the guide’s sweet spot of 60% to 70%. Full marks cycle after cycle are the warning sign, not a low grade.
What is an OKR tool?
It’s software built for OKR tracking. It holds objectives, key results and check-ins in one shared place and keeps their history for you. Nobody maintains formulas, and progress rolls up from each team’s goals to the company view.
Effortbox is the OKR tool we’re building on the same model as this template: key results with a start and a target, and check-ins with a value, a health status and a comment. It’s in early access, so teams join by application, and we set up the workspace with you on a short onboarding call. When your sheet starts showing the signs above, apply for early access.
 OKR and Performance management
 OKR and Performance management
 OKR and Performance management